|
|
1.IntroductionThe latest in a long history of instruments to be developed by the Australian Astronomical Observatory (AAO) Instrumentation Group for the Anglo-Australian Telescope (AAT) is the High Efficiency and Resolution Multi-Element Spectrograph (HERMES) for the AAT. HERMES is a facility instrument, designed to provide high-resolution multiobject spectra in the visible range. The primary science driver is Galactic Archaeology, in which detailed abundances of up to 29 elements are used to chemically tag stars in order to understand their origin and star formation history. The primary program is the Galactic Archaeology with HERMES survey (GALAH),1,2 which has begun as a pilot survey in late 2013 and is now in full data gathering operations. GALAH will measure the chemical abundances of 1,000,000 stars in the Milky Way. HERMES provides a nominal spectral resolving power of 28,000 for GALAH with a high-resolution mode of about 45,000 over four noncontiguous bands within the 370 to 1000 nm window. The spectrograph uses four large volume phase holographic (VPH) gratings and is fed by the 2dF fiber-positioning robot at the AAT telescope prime focus. A new fiber cable contains fibers for both the HERMES spectrograph and the older, lower resolution AAOmega3 spectrograph in such a way that each magnetic button contains a fiber for HERMES and one for AAOmega. This novel approach was introduced to allow for quick instrument changes, without the need to pull the fiber system from the telescope. For both spectrographs, there are two slits of 392 science fibers each that allow for one slit to collect science data while the robot configures the fibers feeding the other slit for the next observation. Details of the 2dF positioner system are available in Ref. 4. The AAO has completed its assembly, integration and testing of the HERMES spectrograph at the AAO headquarters in Sydney; delivered the instrument to the AAT site in mid 2013; and along with the GALAH team, has fully commissioned the instrument in October to December 2013. 2.Top-Level SpecificationsThe HERMES spectrograph is required to achieve the following top-level functional performance specifications:
3.Assembly and IntegrationAt the end of March 2013, initial integration and testing in the Epping-Sydney lab of the HERMES Spectrograph came to a close. Tests were carried out on a fully aligned spectrograph with completed blue, green and red channels. The IR channel, while structurally complete, was not tested as the IR-VPH grating was still being manufactured. Testing in the Epping lab was limited to the use of a test fixture for the slit which is similar to but does not perform to the full standard of the slits attached to the 2dF fiber cable. Included in the testing was the acquisition and reduction of a solar spectrum by illuminating a test fiber bundle with sunlight and feeding that to HERMES. The testing showed conclusively that all the systems within HERMES were operational and ready for shipment to the AAT at Siding Spring Observatory, but that the optical (image-quality) performance in the green and red channels was not within spec. After extensive testing, it was determined that this was primarily due to wavefront errors (primarily astigmatism) introduced in the green and red gratings. It was decided at the time that this issue should not drive the overall HERMES schedule and the issue could be resolved in parallel. In addition, the AAO instrumentation group was required to vacate our Epping facility to move and re-establish ourselves in our new facility in North Ryde, some 5 km from Epping. Our time in Epping had come to a close. In the first week of April 2013, the process of disassembling HERMES, packing and transporting it to the site began. During the disassembly process, HERMES received its NEXTEL black interior paint work. After five weeks, five 20-ft container truck loads, six moving van loads, and approximately 10 station wagon trips, HERMES was safely transported to the AAT. On the last week of June 2013, the reassembly process began at the AAT at Siding Springs Observatory near Coonabarabran NSW. The aggressive goal was to have a fully operational instrument for the scheduled first commissioning run on October 19, 2013. This left a little over three and half months to take a completely disassembled and packaged HERMES to a fully rebuilt, aligned, working instrument. This was quite a challenge but the team was keen. After a complete design and fabrication stage at the site, the HERMES temperature-controlled room was ready to receive its instrument. The first step was to position the vibration isolators in the correct position on top of the concrete piers. The next step of the rebuild process was to reassemble the HERMES structure. This main support structure is called the “spine” of HERMES (Figs. 1 and 2). The spine supports the slit assembly, field lens, collimator mirror, corrector lenses, and beam splitters. There are four structures that are bolted and pinned to the spine, one for each arm of the spectrograph. These structures support a grating, fold mirror, and light baffling. Cantilevered off each of the four channel structures are the camera focus drive assemblies and cryostat assemblies. The HERMES structure was designed to be modular to aid in the disassembly and reassembly process. Fig. 1High Efficiency and Resolution Multi-Element Spectrograph (HERMES) spine being set to air isolators.  Following the rebuild of the HERMES structure, the blue, green and red camera assemblies were reattached (Fig. 3). To save time and keep to schedule the cameras were shipped fully integrated in their structural mount/flexural focus drive mechanism. With the cameras mounted, the 1-m diameter HERMES collimator mirror was reassembled into its mount and then reset onto the structure. All the most massive HERMES components were now set to the frame, fully loading the structure, with the exception of the IR channel structure and camera, which were left until later in the assembly to allow alignment access to the collimator down the center of the spine. The collimator alignment process was now able to commence (Figs. 4Fig. 5Fig. 6–7) with the HERMES collimator mirror first being set to the established optical axis.5 The collimator mirror was tested interferometrically (Fig. 11) in the assembled condition to ensure no stress was being transferred to the surface and it was still meeting the wavefront requirement. Following the collimator mirror alignment the field lens and corrector lens were aligned to the optical axis. The slit assembly (Figs. 8 and 14) was set into position and focus was verified across all fibers of the two slit assemblies as we looked back through the collimator assembly with a metrology telescope arrangement. In parallel with the HERMES reconstruction was an effort to solve the grating astigmatism issue. As detailed in Sec. 4.3, the plan was to repolish the gratings flat and have them recoated. This plan went forward and sucessfully brought the gratings to a completed state just as they were needed for the HERMES channel alignment. With the HERMES collimator assembly fully assembled and aligned, attention was turned to aligning each of the fold paths (Figs. 9 and 10). Alignment progressed from blue, green, red, and finally the IR path. Using prism setups, alignment telescope, and point source microscope, each of the fold paths was brought into alignment with the previously established optical axis. The beam splitters and gratings were adjusted via shimming on their kinematic mounting arrangement. Fold mirrors utilized an integrated precision tip-tilt arrangment in the mount driven by high precision 100-pitch screws. Alignment targets to each of the cameras were previously set, and camera alignment to the optical axis was verified to be within specification [1 arc min (Fig. 11)]. Fig. 8View of the exchanging slit assembly with the two large fiber cables leading to it and back illuminators positioned directly above it, as well as the corrector lens assembly lens as seen through the kidney-shaped baffle (right). 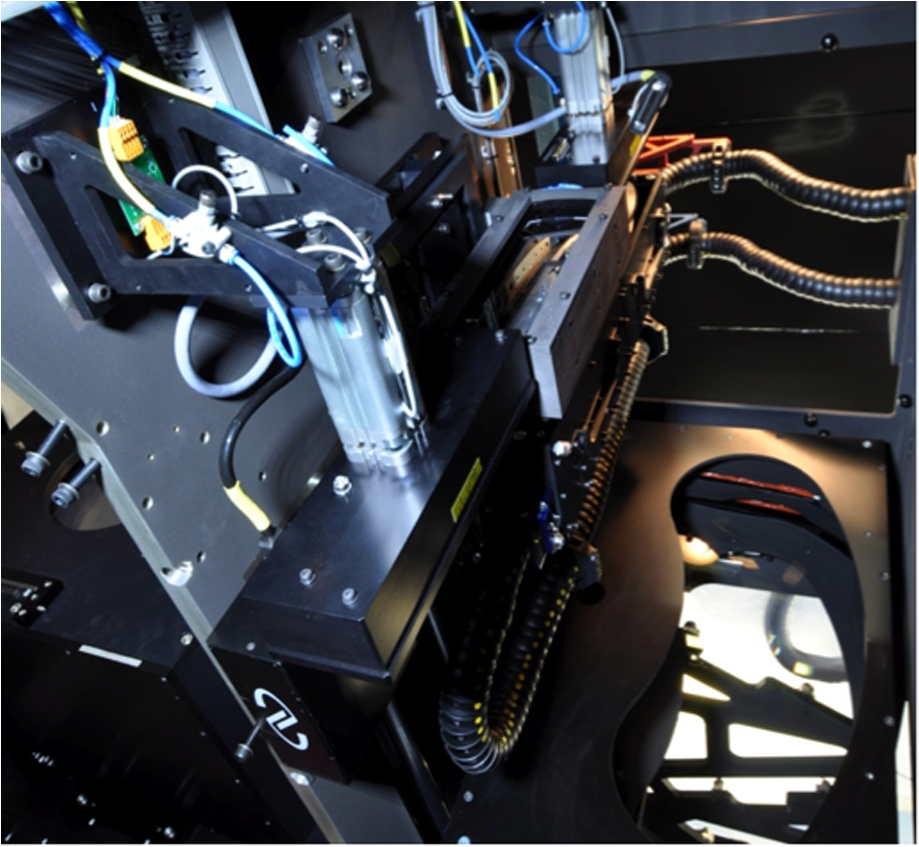 Fig. 11(a) Camera under test with the autocollimating alignment telescope after inferometric testing, (b) IR camera transmitted wavefront using the null lens resulting in a measured wavefront of RMS 0.17 wv and PV 1.88 wv at 632.8 nm. 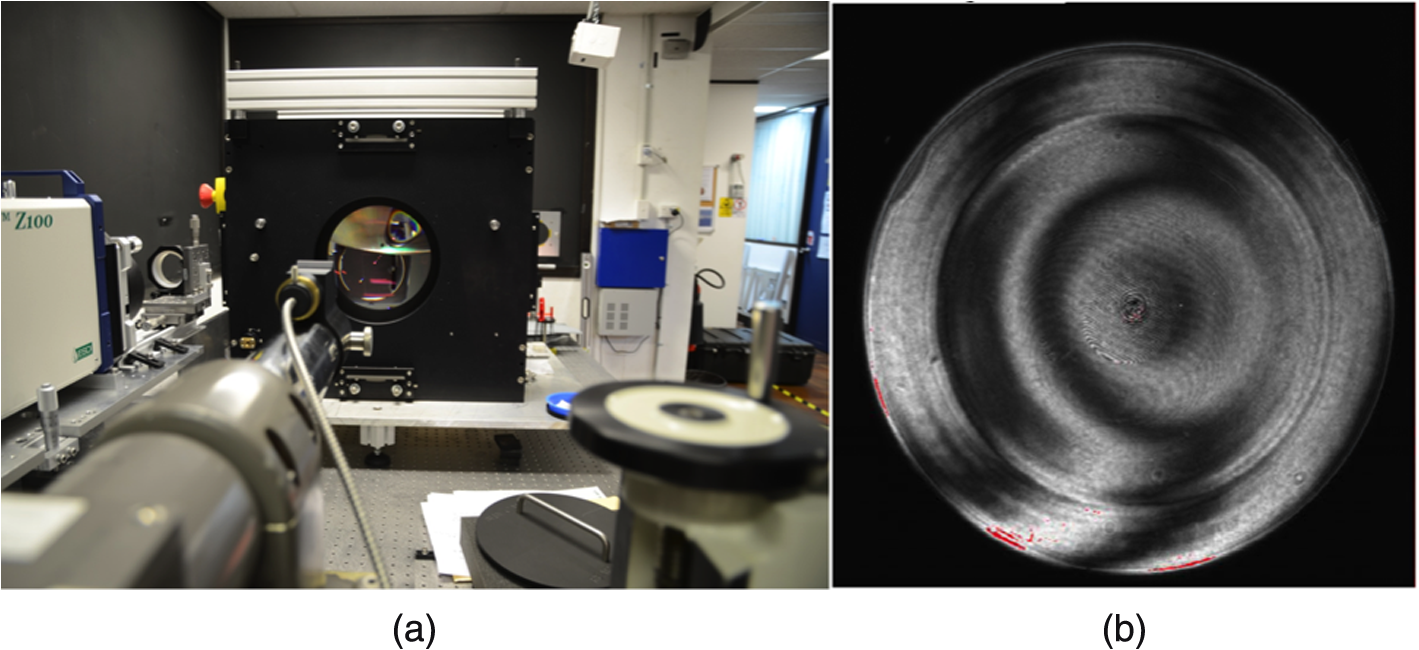 In parallel with the opto-mechanical assembly and alignment, the electronics team reassembled all the electronic control cabinets, ran all the cables to the instrument and fully rewired HERMES. Cryostats were remounted after channel alignment. Controllers were assembled to the cryostats. The process of pumping each cryostat and cooling to temperature began. After each cryostat was brought to temperature, the final alignment of each cryostat to each camera was performed. Cameras were focused utilizing every last minute, but HERMES was ready and saw first light on the well-studied globular cluster 47 Tuc on its scheduled commissioning run on October 19, having been finished with just hours to spare! Since the first commissioning run, HERMES has completed the GALAH pilot survey, and is now taking scientific survey data. The HERMES room is now assembled and complete. Only minor tweaks to the alignment have been implemented. Minor bug fixes have been implemented. The instrument is now fully in the hands of the AAT site staff (Fig. 12). 4.Optical ComponentsThere are three main optical assemblies in the HERMES spectrograph that were deemed high risk. While in a spectrograph as large as HERMES all optics are high risk, the camera assemblies, collimator assembly, and the especially the VPH grating had the most potential to affect performance and delivery schedule. As a result, a series of metrology tests were done to ensure that vendors delivered as promised and to minimize any unaccounted performance losses in the spectrograph. 4.1.Camera OpticsEach of the four cameras in the spectrograph is an refractive design with a 380-mm diameter first element, with an entrance pupil of 190 mm located at the grating (Fig. 13). The camera assembly contains a doublet, with an aspheric first surface, and then three additional lens elements. The camera assembly does not contain the Dewar optics, which consist of two windows and a field flattener lens just above the detector. The vendor supplying the cameras relied on a coordinate measuring machine (CMM) data to align the individual lenses of the camera in the lens cell, which was determined to be insufficient to fully verify performance. To ensure the performance of the cameras two tests were conducted by AAO personnel on the cameras a double pass interferometric test and a lens alignment check with an autocollimating alignment telescope at the vendor facility and again after shipping to the AAO were performed. Fig. 13Optical layout of the HERMES spectrograph. Fold mirrors are used to insure that the design is compact, free of physical interferences, and for serviceability issues such as allowing the Dewars for all four arms to be external to the enclosure.  Each camera was designed to overlap the previous camera’s wavelength coverage for future instrument modifications. While this made the design a little more challenging, this did allow a common null lens to be used for the interferometric testing with only slight modifications to the distance between the null lens, the camera and the interferometer. Due to the weight of the camera, 220 kg, the interferometric testing was designed in such a way that the interferometer and the null lens were brought to the optical axis of the camera. The interferometer was attached to a 250-mm precision linear stage with an reference sphere. The interferometer was aligned iteratively using the returns from camera lens optical surfaces at their respective centers of curvature (COC). By setting the first surface of the fourth lens as a reference as well as the last surface on the third lens, an optical axis was quickly established with minimal distortion from other elements in the system. Furthermore, the inteferometric returns confirmed the lens spacings and defined offset positions for the null lens. Using Monte-Carlo tolerance analysis, the upper and lower bounds were predetermined for a number of Zernike polynomials that would provide a performance evaluation for the cameras, as is typically done for mass produced components. If the inteferometric test proved the performance to be insufficient, then the alignment of each lens could be determined using the autocollimating alignment telescope. The second test uses the autocollimating alignment telescope with a fixed point source set at a distance from the optical assembly. The high-intensity point source is reimaged by each optical surface. By aligning the alignment telescope to two optical surfaces in the camera, the displacement of all the surfaces could be determined using the autocollimator returns from the surface whether real or virtual. Fortunately, the cameras tested well the first time at the vendor facility and again at the AAO requiring only a quick check using the second test method. 4.2.Collimator AssemblyThe HERMES spectrograph uses an off-axis Houghton-based collimator design with a slit curved to match the radius of the focal surface as presented to the spectrograph and curved again perpendicularly along the surface of the sphere to compensate for the spectral smile (Fig. 14), which is described in Sec. 9.5. The collimator consists of a relatively small field lens, a 1-m diameter spherical mirror weighing 500 kg, and two off-axis corrector lenses in diameter in an assembly weighing 250 kg. The collimator optics each had their issues. While each issue was found in testing, some were expected due to good reporting from vendors, and others were uncovered later in the process. The collimator mirror is 960 mm in diameter and it has a 150-mm center thickness (Fig. 15). HERMES uses only the central almost rectangular area of the mirror . The mirror aperture is baffled to these dimensions. The interferometric acceptance test for the collimator mirror is shown in Fig. 16. In practice, the mirror was rotated about its axis of symmetry in order to determine the location of the clear aperture with the best wavefront quality. Fig. 14(a) The two curved slit assemblies on the translation stage and (b) V-groove block for lens mounting 40 lens sets. Each lens set is used to modify the F/# output from 10 fibers to match the collimator input, including a margin for FRD. In this way the light from all 400 fibers are correctly injected into the spectrograph.  Fig. 15(a) The HERMES collimator mirror and (b) corrector lens. The corrector lens is shown during acceptance testing, lenses are baffled to the elongated and curved clear aperture 540 mm long and 200 mm wide. Red dot identifies the location of the optical axis of the spectrograph on the corrector lens cell.  The mirror is coated with enhanced silver coatings to improve throughput at 370 nm. The mirror had two issues. One, the mirror is strap mounted using an invar and stainless steel chain. This made the mirror very sensitive to gravitational loading which was created if the mirror was unbalanced with respect to the gravity vector and the face contact pads. This required interferometric testing at the time of integration to qualify the angle of the mirror with respect to gravity so the mounting did not inadvertently load the mirror face on the front reference pads. Two, the enhanced silver coating has proven challenging on two fronts. The coating performance proved very challenging to obtain on such a large mirror and the adherence of the coating is proving softer than promised. While witness samples of the coating passed testing for adhesion and abrasion requirements using MIL-C-48497, the coating on the mirror itself has proven soft and uncleanable via contact methods, as it does not conform to MIL-C-48497. Contact free cleaning of the mirror can be still performed to remove accumulated dust. snow cleaning does not damage the reflective coating. Major contamination of the mirror surface is not anticipated due to the isolated operational environment of the HERMES spectrograph. The instrument has an enclosure preventing direct access to all optical elements. In addition, the spectrograph is located in a dedicated temperature controlled room fed by filtered air. It is expected that the GALAH survey will be finished with the current coating with a possible upgrade in the future. The corrector consists [Fig. 15(b)] of two lenses with zero total power in the collimated beam. The clear apertures of the corrector lenses are located off-axis. The purpose of the corrector lenses is to compensate for aberrations of the off-axis beam produced by the spherical mirror. The lenses are air-spaced which allow for the weakly powered surfaces to correct for the spherical aberration, astigmatism and coma. Chromatic aberrations are small, therefore, the lenses can made of the same material (Schott BK7 glass). The fabrication and alignment of the collimator corrector lenses proved difficult from the onset. Due to the sheer size of the refractive off-axis element, it was deemed not cost effective and technologically too challenging to make a full-size on-axis parent. Thus, the blank size was restricted to the final as-built size of the lens to reduce costs. This made the fabrication of the second surface on each corrector lens particularly challenging as the surface became a tilted/decentered spherical surface with respect to the first surface. The alignment by the vendor relied on a large three axis CMM to square each surface in assembly. It was first thought that this would provide an accurate alignment even with the limited number of sampling points at each step in the alignment of the two lenses in a common cell. Unfortunately, the CMM proved to be less effective in this instance than originally planned. Possible sources of the error are: (1) for the long radius of curvature on two of the surfaces, 3813 and 1986 mm, the sagittal radii difference proved to be too small to discern over the error of the machine for a given sampling area, (2) the sampling area was too small, and (3) possibly that a mounting flange was ground into one of the lenses at the wrong angle. The solution was then to rely on interferometric testing. An interferometric double pass test taken at the stage of acceptance at the vendor’s premises measured the wavefront error 0.5 waves PV at 632.8 nm. CMM results were complemented by the autocollimating alignment telescope which was used to image the COCs of each lens surface. Further analysis in optical design software concurred with interferometry and agreed with the contribution from the as built corrector assembly. Although the corrector lenses could be realigned within the cell to null the wavefront error, a different approach was taken due to time constraints. Based on the optical model, the wavefront error introduced by the corrector into the spectrograph system could be compensated by the decenter of the as-built collimator assembly by 1 mm. The correction was implemented during alignment of the corrector lenses with respect to the collimator mirror using the alignment telescope and interferometric measurements. Double-pass interferometric testing proved this approach to be successful in allowing the collimator assembly to reach its wavefront-error spec. 4.3.VPH GratingThe VPH gratings used in HERMES are among the largest yet produced for astronomy. There are four gratings, each in size, with line frequencies from 3827 to working at a 67.2-deg angle of incidence. They proved not only a challenge to manufacture, but also to quantify the optical errors introduced in the manufacturing process. As highlighted in earlier papers,1,6–9 the extreme working angle of the grating forced the design of the grating to be optimized for s-polarization. Due to the size, the working angle of the grating and the high resolution, a custom large-aperture metrology system had to be built at the AAO to test the gratings for spectral and wavefront performance. This metrology system was used to measure the line frequency homogeneity, the line orientation (for multiple exposure gratings) along with the absolute line frequency and hence, the blaze angle. The metrology station was then modified in order to measure the wavefront error of the surface-reflected beam; the transmitted beam; and the diffracted beam in the as-used angle of incidence. At this time, it was determined that the wavefront error was approximately two orders of magnitude out from the system error-budget requirements for two of the four gratings. We note that the vendor was unable to sign up to a wave-front error spec during the bid and order process. The likely issue was with the manufacturing processes, as the deformation of the carrier glass is very hard to control due to the internal stresses from the gelatin and bonding process. After much deliberation, the project team decided to attempt a postpolish of the completed gratings in order to remove the deformation from the outer surfaces. The method proved to be successful and after retesting it was determined that the internal errors within the grating were below the system-level error-budget requirements. Before repolishing, both substrates of the red VPHG were curved to form a weak biconcave lens [Fig. 17(a)] with a sagittal plane of . Subaperture measurement (100 mm beam in diameter) easily characterized this dominant wavefront error. After repolishing, interferometric measurements confirmed the good quality within every individual subaperture. Due to large area of the grating, the wavefront error was extrapolated over the entire aperture [Fig. 17(b)] to yield only 0.2 wave PV error at 62 deg incidence/diffraction angle. Fig. 17(a) Red VPHG transmitted wavefront error profile before repolishing and (b) red VPHG transmitted wavefront at repolish at working angle of 62 deg.  One might ask if making the carrier glass thicker would solve the problem. We considered this, but due to the size of the gratings in HERMES the glass weight quickly becomes unmanageable and more importantly would require complete retooling at the manufacturer facilities if the glass diameter to thickness is made on the standard ratio with respect to the long axis of the diameter. Another important point for future spectrographs of equivalent size to HERMES using large VPH gratings is the number of carrier plates needed during the manufacturing process. The AAO purchased 13 plates for only four gratings. This high number of carrier plates was required by the vendor due to the difficult nature of this project. These gratings were among the largest aperture, highest frequency and tightest tolerance gratings with respect to fringe homogeneity and orientation and throughput ever produced. Each successful grating required numerous iterations in which the process variables were modified one-at-a-time. The end result speaks for itself. 5.Cryostats and DetectorsTable 1 summarizes the e2v CCD231-84 , pixel detectors currently in use in HERMES: The blue, green, and red channel devices are cosmetic grade 0. The “IR” channel device is essentially a cosmetic grade 0 device, but has some serial register defects. For this reason, the device received a grading of 5. Despite the defects, it has been used successfully in HERMES. The manufacturer did provide a replacement device free of charge. Table 2 summarizes the readout noises for each detector measured in the lab at various readout “speeds.” Table 1High Efficiency and Resolution Multi-Element Spectrograph (HERMES) detector configurations.
Table 2HERMES detector readout modes and noise characteristics.
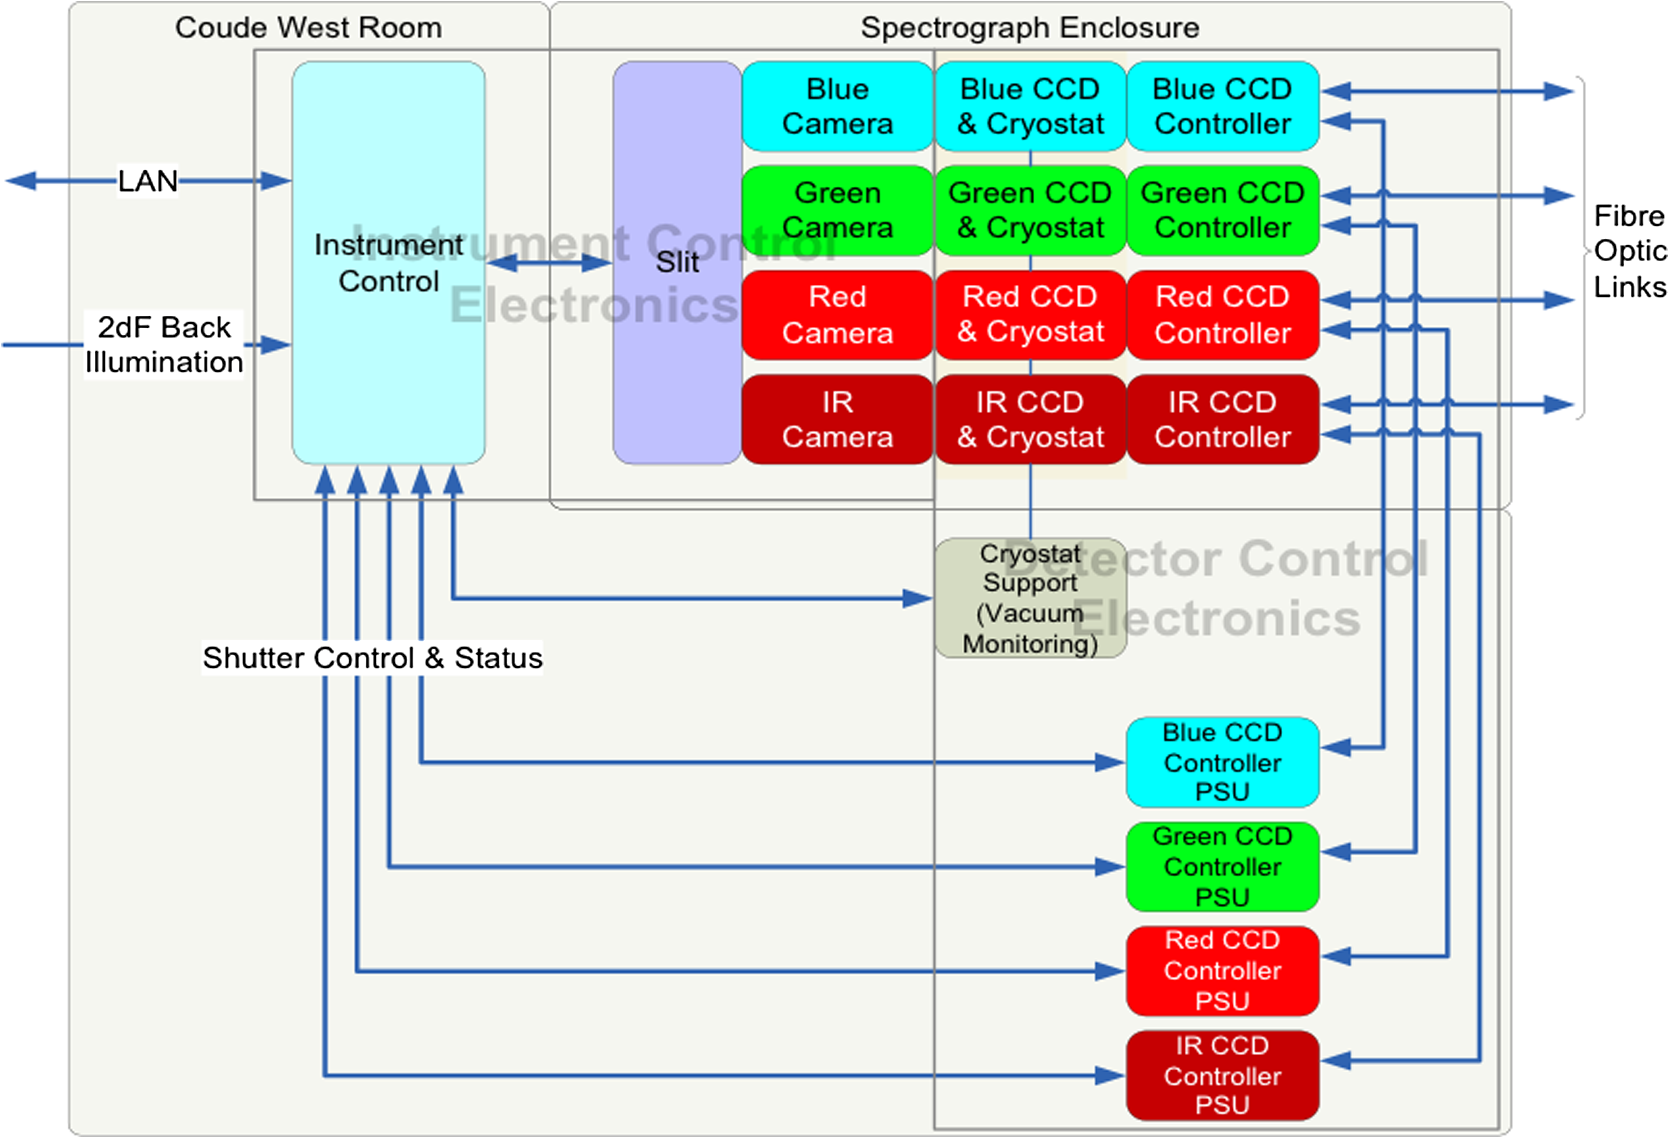
The HERMES detector cryostat shell is based on an Infrared Laboratories cryostat with a Polycold PCC cryocooler cold head to which we have fitted a Pfeiffer PKR full range vacuum gauge head. The end plate is replaced by a custom shell extension which encloses the detector and field flattener assembly. Hermetically sealed connectors, one for the detector control and data, another for thermal control, are mounted through the wall of this shell extension. To maintain thermal isolation, a G10 fiberglass “spider” is used to locate the detector and field flattener to the wall. To ensure a good match to the thermal expansion of the CCD detector, a molybdenum mounting plate is used. The thermal control hardware, heaters and a diode sensor are mounted directly on this plate. Three heaters are used to provide an even distribution of the heat input required for temperature trimming to much less than 0.1°C. The mount for the biconcave field flattener lens is mounted with less than a 4-mm gap from the detector (Fig. 18). Cooling of the detector assembly is implemented by linking the detector mounting plate to the cryocooler head using oxygen-free copper thermal links. To minimize thermal strains and maintain detector alignment, these links incorporate corrugated sections which structurally decouple the cryocooler head from the detector assembly. The contamination “getter” is also connected via separate links to the cold head. A radiation shield encloses the detector and field flattener assembly and the thermal link and getter assembly. The cryostat shell is sealed by a front plate which accommodates the plane window, which withstands the atmospheric pressure load and a second thinner window. Dry nitrogen may be flushed between these windows to prevent dewing that might otherwise occur on high-humidity nights. Internal electrical wiring is accomplished using flexible PCBs and the detector controller electronics box is mounted directly on the cryostat shell to minimize noise. Design variations between cryostats result from the different wavelength ranges at which they operate and are limited to different CCDs, field flatteners and window coatings. The detector control electronics include the CCD controllers and their power supplies for each detector, as well as the computer systems that send commands to and acquire data from the CCD controllers. Each CCD detector in HERMES is controlled with an AAO2 CCD controller.10 These controllers are configured for operation with the e2v CCD231-84 detectors to permit readout from one, two or four detector outputs, at various readout rates with windowing and binning. 6.Fiber Cable FeedA new combined HERMES/AAOmega fiber bundle was constructed,11 with two fibers in each magnetic button assembly. Thus, all 392 target fibers could be fed to one spectrograph or the other, avoiding the need for any instrument changeovers: only the fiber configuration has to be changed to switch between HERMES and AAOmega. The fiber button assembly is shown in Fig. 19. The 2dF robot positions the magnetic button on the field plate and determines its position by looking at the back illuminated science fiber. Fig. 19(a) 2dF button; 1–prism, 2–AAOmega/HERMES science fibers, 3–dummy fiber, 4–glass ferrule, 5–polyimide tube, 6–magnet, 7–button body (prism size is 1 mm). (b) The back-illuminated output slitlet, containing 10 fibers as seen from the spectrograph. 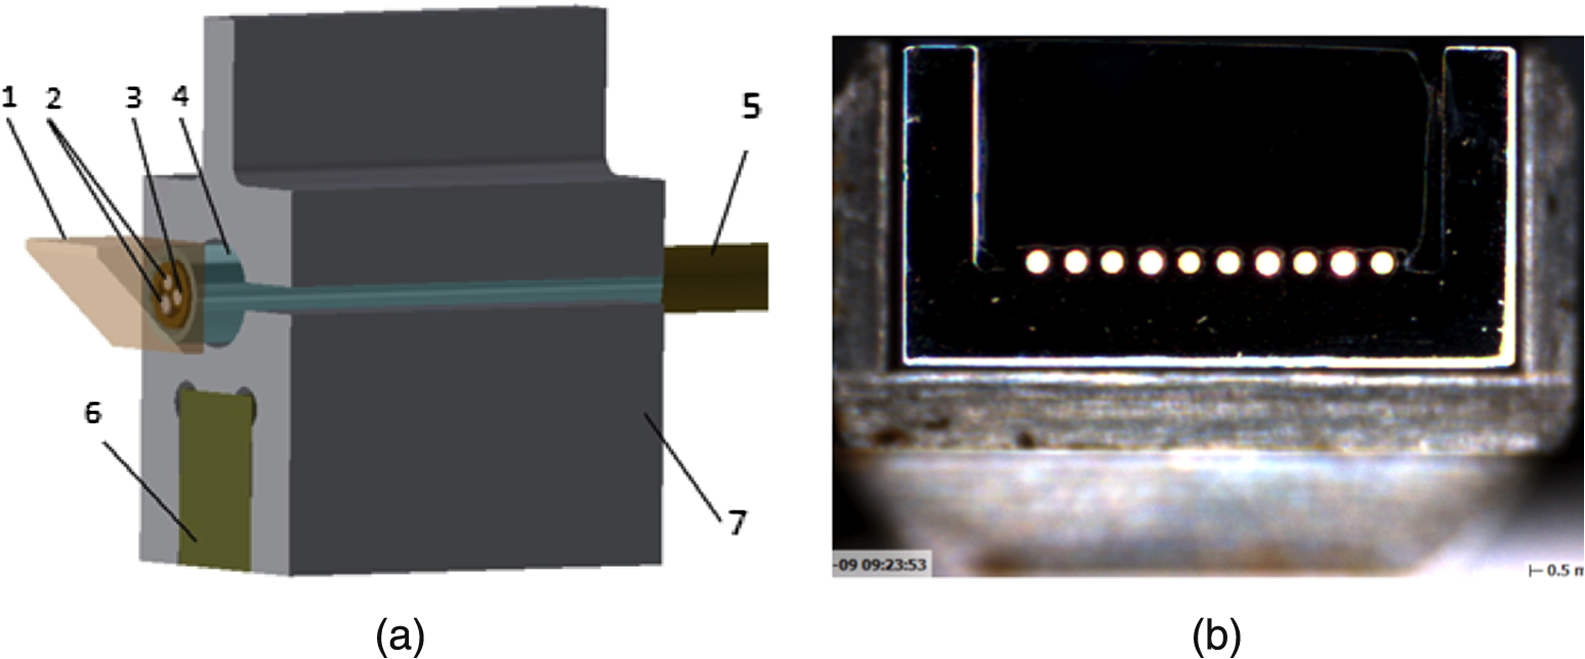 The 2dF buttons are comprised of fibers terminated in a glass ferrule with a polyimide jacket covering the two AAOmega/HERMES science fibers plus a short (30-mm long) dummy fiber to align the fibers perpendicular to the prism face. These ferrules are then glued into magnetic buttons to locate them on the 2dF field plate. The images show the assembly. At the slit entrance, the fibers are assembled in slitlets that locate 10 fibers in v-grooves and collectively they make up a slit of 400 fibers. The HERMES slitlets were successfully glued and polished. The locations of the fibers in their v-grooves with respect to their nominal positions relative to the slitlet body were measured using a MicroVu co-ordinate measurement system. The fiber locations were within the required radial position tolerance of to minimize crosstalk in the detector images. The existing cable had a fringing problem that caused a wavelength-dependent intensity fluctuation in the measured spectra. This was found to be due to a cavity, sort of a Fabry–Perot etalon, that was formed between the prism and the fiber face at the button end of the fiber cable as a result of a partial failure of the adhesive. This connection has been redesigned and with new adhesives that have a better thermal match, low shrinkage and create a stronger bond. The assembly was tested on the AAT for five months, with no fringing observed. Another point of attention has been to prevent the fibers from stressing as this can cause focal ratio degradation (FRD). With a fiber cable of almost 50 m in length, there are many points where the fiber is bent and anchored. With large bending radii, protective sleeves and low stress points at anchor points, the FRD was kept low and the achieved throughput for the new fiber cable tracking the estimates was based on the throughput model. Measurement of the end-to-end throughput for the HERMES fiber averaged overall fibers is 62% at 505 nm as compared to the predicted throughput of 66%. Differences are attributed to residual FRD. Monitoring the stability of the throughput for the fiber cable is an ongoing exercise. Current monitoring for the HERMES fiber cable over the past 5 months shows no degradation. Details of the overall monitoring program are available in the literature,12 which discusses the results of the past 6-years of historical throughput data for the AAOmega fiber cable in detail. 7.Controllers and ElectronicsThe electronics for HERMES are broadly separated into two categories: instrument control electronics and detector control electronics, as shown in Fig. 20. The HERMES instrument control electronics is responsible for controlling and monitoring all the actuators and sensors used to configure and operate the instrument. The instrument control electronics is based on a distributed control system that uses the CANopen protocol running on the controller area network (CAN) field bus. All analog and digital functions are interfaced to CANopen input/output nodes and all servo motor driven actuators are controlled by CANopen digital servo drives. The CAN bus is connected to an industrial control cabinet PC with a CAN interface, running the Linux operating system, and operating as the CANopen master. The instrument control electronics is implemented in six industrial electronics enclosures distributed around the outside of the spectrograph thermal enclosure. The majority of the instrument control electronics is commercial off-the-shelf. Some customization has been done on the slit back illumination control and drive, interlocking and interfacing for the Bonn shutters and servo amplifier breakout. The CAN/CANopen system including a digital servo drive and the digital and analog input and output was prototyped during the final design phase of the project. This has been available to allow software and hardware development and testing to proceed from an early stage in the project. 8.Software and Data Reduction8.1.Architecture and LayoutExtensive use was made of existing software deployed as part of the 2dF/AAOmega instrument. This software was written using the AAO’s DRAMA API13 for the deployment of the original 2dF instrument configuration, in 1994, but has been modified over the years for new spectrographs, detector systems and configurations. For development purposes, the software for HERMES was broken down into five major areas. The observing system is responsible for overall control of the entire observing run-time (including the 2dF robot and CCD operations) and provides the main GUI. The HERMES spectrograph control task is responsible for control of the spectrograph itself. The AAO2 CCD detector software,14 shown schematically in the Fig. 21 as “AAO 2 CCD systems,” is used to run the detector systems. The fiber configuration software, not shown, is responsible for allocating fibers to objects as part of the proposal preparation. A separate data reduction package provides pipeline reduction to the point of producing calibrated spectra. 8.2.HERMES Observing SystemThe existing 2dF observing system has been modified to control HERMES in addition to AAOmega. The observing system controls the 2dF fiber positioner, spectrographs, detector systems, 2dF calibration system, 2dF atmospheric dispersion corrector, telescope, and a number of minor components. Each subsystem has its own DRAMA task. The AAO2 CCD detector software is itself an independent set of DRAMA tasks used by the 2dF software, as is the AAT’s telescope control software. Overall control, software interlocking and synchronization are provided by the 2dF control task. This observing system has proven flexible and adaptable since being originally commissioned in 1994, with the CCD system, telescope system and spectrographs having been changed during that time. For HERMES, we adapted the control task to implement a new mode of operation where the AAOmega spectrograph DRAMA task is replaced by the new HERMES spectrograph DRAMA task. Additionally, the control task and detector software were adapted to control four CCD systems, rather than the two previously supported. Switching between AAOmega mode and HERMES mode is via a command line option at system startup. All subsystems of the 2dF observing system are required to implement simulation modes that allow for development of the observing system without access to the instrument hardware. This was used extensively and as a result, the 2dF control task was largely adapted to work with HERMES before the instrument itself was completed. 8.3.Spectrograph ControlThe HERMES spectrograph DRAMA task replaces the AAOmega spectrograph task when 2dF is running in HERMES mode. This task is responsible for communication with the spectrograph hardware and implementing high-level commands (DRAMA commands) for controlling the hardware. It provides the instrument state for inclusion in FITS file headers and makes status information available via DRAMA parameters for inclusion in the system GUI. An extensive hardware simulator has been provided using instrument simulator technology previously developed at the AAO.15 This provides simulation of the CANBUS electronics hardware of the spectrograph at a level that requires no changes to the spectrograph task when running in simulation. Individual components of the instrument may be simulated at will. We used this extensively to advance development of the spectrograph task. 8.4.CCD ControlHERMES was the first AAO Instrument using up to four readouts (quadrants) per detector. It is also the first instrument using four detectors at once and using large detectors of . Previous instruments were limited to two readouts per detector and two detectors at once. The AAO 2 CCD software was designed to support four readouts, but with no such detector configuration previously available, the implementation was not completed. We have now been able to complete this implementation, while at the same time optimizing the HERMES detector control modes. Adaption of the software to support four detectors running in one configuration was made early in the HERMES project, and we regularly operated four detectors in simulation whilst adapting the 2dF control task for HERMES. Due to hardware limitations, we only had two detector controllers available simultaneously before the HERMES instrument was moved to the AAT, so the final testing of the detector control configuration was not possible until then, but all high-risk areas had been tested and the final move to four detector controllers was completed without any issues. 8.5.Fiber AllocationTo observe a field on 2dF, you must allocate objects to fibers. This is done using a program known as “AAO Configure.” Implemented originally for 2dF in 1994, it has been adapted to support the 6dF Instrument on the UK Schmidt Telescope and FLAMES on the VLT UT2, and to support various changes in 2dF over the years. It has also been modified to implement a simulated annealing allocation method.16 Minor changes were required for HERMES–basic instrument support and supporting the use of proper motions. Proper motions had been supported in the FLAMES implementation, but had not been implemented with 2dF until now. The allocation algorithm was modified for HERMES to optimize for fiber efficiency considerations such as crosstalk. 8.6.Data Reduction and Data SimulatorThe AAO provides software to reduce the image data files produced by HERMES in order to generate calibrated spectra with all instrument signatures removed. Science processing is left to the science teams, but in this case there was a clear requirement to interface efficiently to the Galactic Archaeology abundance pipeline. The AAO’s existing fiber instrument reduction package—2dFdr, was adapted to support HERMES. This package had previously proven to be adaptable to different instruments and such adaptations are now relatively easy to implement. The signal-to-noise requirements on HERMES for the Galactic Archaeology project, combined with the high resolution of the instrument, have meant fairly substantial changes to some sections of 2dFdr. In an effort to avoid the typical delay of 6 to 12 months after instrument commissioning before data reduction is optimal, we implemented a HERMES data simulator;17,18 unfortunately, it was not able to capture a number of the characteristics of real HERMES data. The following significant improvements have been made to the software:
Currently, the Galactic Archaeology team is undertaking the analysis required to complete characterization of the data to allow us to further optimize the reduction. 2dFdr development projects for the future include the use of twilight and dome flats to map the illumination of the lamp flats; the use of sky emission lines for determining throughput in each fiber, which is critical for accurate sky subtraction; development of a 2-D deconvolution or “spectroperfectionism” algorithm for spectrum extraction; and removal of the VPH Littrow ghost. 9.Spectrograph Performance9.1.Spectrograph On-Sky PerformanceHERMES on-sky commissioning was carried out over the months of October, November, and December in 2013. A range of observations were carried out and covered a lot of ground; determining readout speeds and combination of amplifiers, the required calibrations and their exposure times, point spread function (PSF) variations, fiber cross talk and scattered light levels, and overall instrumental resolution and throughput. This information allowed selecting the default instrument settings to determine the magnitude limits, to set up the focus procedure, and to confirm the appropriate alignment of the optics. A summary of the commissioning results is presented. 9.2.Spectral ResolutionHERMES provides two resolution modes, the nominal resolution mode of and a higher resolution option utilizing a slit-mask (at the cost of 50% light loss). The HERMES nominal and mask mode spectral resolution was measured using the ThXe calibration lamp exposures. 9.3.ThroughputThe throughput of the AAT + 2dF + HERMES system was determined by measuring the detector counts over a range of standard star observations. The overall flux transformation equations (from star to detector) are given below for each channel:
Note that in the above transformations, , , , refer to the Johnson , , , and filters which are the nearest photometric bands to the four HERMES channels, and are based on the median seeing (1.5’’) conditions at Siding Spring Observatory. Table 3 gives the corresponding magnitude limit to achieve electrons () per resolution element in one hour of exposure time, along with the associated instrument throughput based on these measurements (See also Fig. 22). Table 3The magnitude limits for each HERMES channel to achieve 104 electrons per resolution element in the nominal HERMES resolution mode along with measured system throughput including telescope, fiber, spectrograph, and detectors under typical seeing of 1.2 arc sec.
Fig. 22HERMES can meet the design requirement that signal to noise per resolution element (S/N) should be 100 at in 1 hour of integration time, though this is modulated by the seeing. We have chosen stars with V magnitudes near 12, 13, and 14 (top, middle, and bottom panels) from fields for which our observers recorded seeing of 1’’1 (black), 1’’5 (magenta), 2’’0 (blue), and 2’’6 (green). We measure the mean value for S/N at 60 min, of 111.4 (seeing = 1’’1), 93.4 (seeing = 1’’5) and 88.6 (seeing = 2’’0). Our observers extend the integration time by 20 min when the seeing is worse than 2’’ and by 60 min when the seeing is worse than 2″5, and it can be seen in the figure that this is effective at bringing the S/N up to the required levels.  The use of the high-resolution mask reduces the flux by a factor of two, raising the limiting magnitude by 0.7 mag. Overall, the HERMES throughput performance meets the required specification to obtain a signal-to-noise of 100 per resolution element for a 14th magnitude star within one-hour exposure time. During lunar bright time, the sky background limits observations of targets fainter than the 14th magnitude. In darker skies, HERMES could be used to observe targets down to the 17th magnitude over extended exposure times to achieve an S/N ratio between about 30 to 50. Details of the GALAH Survey are available in Ref. 23. 9.4.Ghost and Scattered lightScattered light in the form of dispersed background light from surface reflections is minimal in HERMES. The interslitlet regions on the detector can be used to measure the minimum signal and model the shape of the scattered light with a low order polynomial and subtract it as part of the standard data reduction process. A Littrow ghost, typical for a VPH grating used close to its Littrow configuration, affects HERMES data in all channels. The ghost images appear as small localized spots (Fig. 23) and fall spatially mirrored on the detector in a predictable manner forming the shape of the curved slit. The intensity of the ghost is at most 0.03% of the total flux in the originating fiber. 9.5.PSF Variations and Fiber Cross TalkThe optical PSF varies across the detector both spatially and spectrally in all channels. At the spatial center of the detector, the PSF convolved with a fiber image is circular with a typical spectral FWHM of 3.5 pix at the blue wavelength end of the detector increasing to ellipse-shaped PSF convolved with a fiber images with a typical FWHM of 5.0 pix at the red wavelength end of the detector. At the spatial top and bottom regions of the detector, the elliptical PSF convolved with a fiber image is inclined in opposite directions. As shown in Figs. 24 and 25, this pattern matches the optical design of the instrument. Fig. 24(a) Image of an arc exposure zoomed in the center of the detector in the HERMES Red channel. The point spread function (PSF) convolved with a fiber images are round and the PSF convolved with a fiber images for adjacent fibers do not overlap significantly. (b) Image of the same arc exposure zoomed in the top of the detector. The PSF convolved with a fiber image is now an inclined ellipse and the PSF convolved with a fiber images for adjacent fibers do partly overlap.  Fig. 25(a) The design PSF of the spectrograph; (b) a mosaic of measured fiber images from the center and edges of the field for a blue camera arc exposure, compared with 25c; (c) a set of corresponding predicted images from Zemax ray-tracing done during the optical design study. The distortions seen toward the edges of the field match the predictions well. Horizontal is the spatial direction.  Aberrations in the spectrograph are very well corrected and yield PSF (Fig. 25) much smaller than the projected geometric fiber image of 4.9 pixels in diameter. Convolution of the fiber face with PSF would be close to the flat top profile. However, the shape of the spectral resolution element varies across the CCD, being determined by the fanned distortion commonly known in spectroscopy as “smile.” This effect consists in dependence of magnification on field angle, images of fibers follow arcs at constant wavelength, the curvature and sagitta of the arcs increase with wavelength. The HERMES slit is designed to compensate for the spectral smile distortion by configuring fibers along the curvature of the opposite sign (Fig. 15). The spectrum becomes very compact to match the CCD imaging area and the slit image is straight in the spatial direction. At the same time, the inherent distortion causes variable anamorphic magnification dependent on field position and wavelength. The fiber core image remains affected and scaled accordingly as shown in Fig. 25. The extension of the resolution element in the spectral direction reduces the effective spectral resolution, but the most significant impact of this is on the fiber-to-fiber cross talk within each slitlet (see Fig. 26). The cross-talk level is such that 3 to 5% of the flux from a fiber in the first and last 100 fibers affects its adjacent fibers. Given the limited hardware options to remove or reduce the observed crosstalk, this level of crosstalk will require care during data reduction. Options being investigated include extracting the spectra using a 2-D deconvolution and hard-edge clipping the affected data, which would cause a loss of signal but would ensure minimal contamination. Fig. 26(a) Plots of flux versus pixel position for a vertical cut across a fiber flat field image, zoomed in the center of the detector in the HERMES red channel. Note the flux going down to the bias level between the two slitlets, and the flux between the individual fibers goes down similarly. (b) Plots of the vertical cut in the same fiber flat, zoomed into the top of the detector. Note, here, the flux between the two slitlets goes down to bias level, but the flux level between individual fibers does not, indicating there is illumination from the adjacent fibers.  9.6.HERMES Reference SpectraA short 30-s exposure of the daytime sky was observed with 2dF + HERMES. The resulting data were reduced and extracted (see Fig. 27). The data was processed through the GALAH analysis pipeline and was found to be in good agreement with solar spectra from other high-resolution spectrographs VLT + UVES and Keck + HIRES. Figure 28 shows the reduced spectra taken with HERMES of two Gaia benchmark stars. Epsilon Eridanus, with nearly Solar metallicity and was observed July 10, 2014, with an . The measured V channel for this observation. Fig. 28The reduced spectra taken with HERMES of two Gaia benchmark stars, Epsilon Eridanus, with nearly Solar metallicity and HD 84937 with [Fe/H] of −2.08. 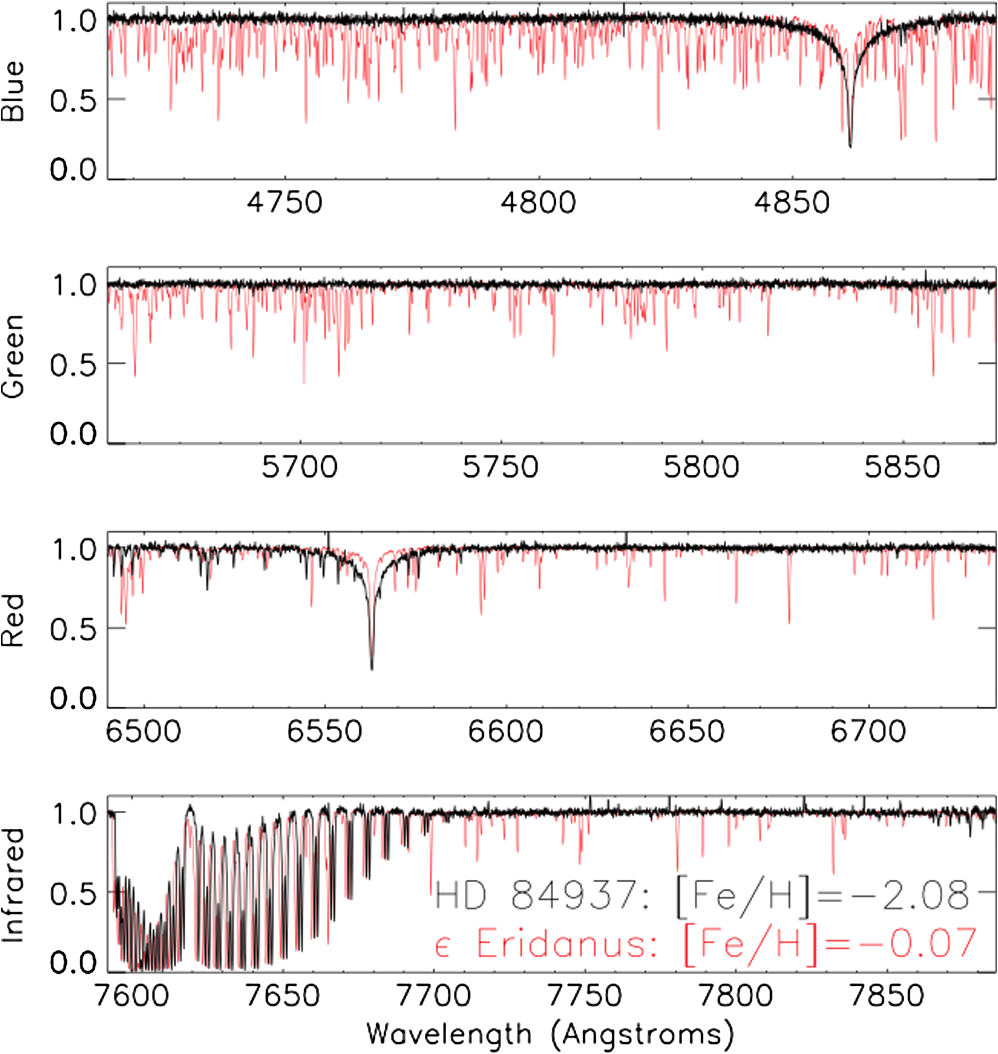 HD 84937 with [Fe/H] of and was observed December 16, 2013, with an . It has a measured V channel . While it is difficult to predict the S/N for these observations because single star observations are typically not done with benchmark stars (which helps to keep the target stars aligned on a fiber), these S/N results were very encouraging. 10.GALAH Survey UpdateThe primary science driver for the HERMES spectrograph is to carry out a large-scale Galactic Archaeology survey of the Milky Way.23 The goal of Galactic Archaeology is to reconstruct the lost substructures of the proto-galaxy, thereby obtaining a detailed physical picture of the formation and evolution of the Milky Way. The GALAH survey is designed to carry out this task using the chemical tagging technique as a means to exploit the vast chemical inventory of one million disk stars.24 The GALAH survey is an Australian-led project with members from nine Australian institutes and several key international partners. 10.1.Pilot SurveyThe GALAH team conducted a pilot survey from November 2013 to January 2014 to test survey strategy as well as carry out extended tests that were not possible during formal HERMES commissioning. These data address questions such as the quality of flat-field correction from the various lamp options, repeatability of targets between fibers and plates, acquisition and guiding dependence on input catalogue parameters, and the overall stability of calibrations. GALAH observations have contributed a total of 56 h to acquire HERMES test data. The pilot survey obtained spectra of individual science targets, including fundamental calibration stars, calibration open, and globular star cluster fields and specific targeted science fields. These are used for testing the data reduction and analysis pipelines over the range of stellar parameters covered in the GALAH survey. 10.2.Observation SummaryThe GALAH survey has been granted 219 nights of observing time over the period of February 2014 to January 2017 for the first phase of its main observing campaign. In the first 60 nights of the main survey, GALAH observed 76,688 stars in 216 main survey fields (Fig. 29), as well as the previously mentioned HERMES test data. Seventeen of the survey fields observed to date lie within the observational field of the Kepler-2 mission25 and more will be observed in the future. Kepler-2 will use asteroseismology to determine stellar properties, and this addition of independent and complementary data will allow the determination of ages for some GALAH stars, information that is very difficult to derive from purely spectroscopic data. The GALAH analysis pipeline conducts the required bookkeeping of the observations, data reduction checks, radial velocity determination, continuum normalization, and operation of the spectrum synthesis determination of abundances. A series of papers outlining the survey goals, observational strategies and detailed pipeline processing are in preparation, expected to be online by early 2015. Fig. 29The distribution across the sky of pilot survey (red), test (orange), main survey (green), and Kepler-2 (blue) fields. Main survey fields that also serve as test data are shown as green circles with an orange ring. There are 4303 field centers, shown as gray open circles, which are tiled into 6546 “configurations” containing 400 unique stars. The ultimate goal of a million-star sample requires observing 3200 of these configurations.  11.ConclusionsThe AAO has finished another very successful spectrograph, the HERMES spectrograph. The spectrograph is facilitating the GALAH Galactic Archeology survey, which is well on its way to achieve the goal of measuring abundances of 1,000,000 stars within the Milky Way. The instrument is performing to specification and the observations are underway. ReferencesS. Barden et al.,
“Concepts for a high-resolution multi-object spectrograph for galactic archeology on the Anglo-Australian Telescope,”
Proc. SPIE, 7014 70144J
(2008). http://dx.doi.org/10.1117/12.788549 PSISDG 0277-786X Google Scholar
J. Bland-Hawthorn, M. Krumholz and K.C. Freeman,
“The long-term evolution of the galactic disk traced by dissolving star clusters,”
ApJ, 713 166
(2010). http://dx.doi.org/10.1088/0004-637X/713/1/166 Google Scholar
R. Sharp et al.,
“Performance of AAOmega: the AAT multi-purpose fiber-fed spectrograph,”
Proc. SPIE, 6269 62690G
(2006). http://dx.doi.org/10.1117/12.671022 Google Scholar
I. J. Lewis et al.,
“The Anglo-Australian Observatory 2dF facility,”
MNRAS, 333
(2), 279
–298
(2002). http://dx.doi.org/10.1046/j.1365-8711.2002.05333.x Google Scholar
L. Gers and N. Staszak,
“The deterministic optical alignment of the HERMES spectrograph,”
Proc. SPIE, 9151 915113
(2014). http://dx.doi.org/10.1117/12.2055574 Google Scholar
S. C. Barden et al.,
“HERMES: revisions in the design for a high resolution multi-element spectrograph for the AAT,”
Proc. SPIE, 7735 773509
(2010). http://dx.doi.org/10.1117/12.856103 Google Scholar
J. Brzeski and L. Gers,
“Hermes–the engineering challenges,”
Proc. SPIE, 8446 84464N
(2012). http://dx.doi.org/10.1117/12.924635 PSISDG 0277-786X Google Scholar
J. A. C. Heijmans, L. Gers and B. Faught,
“Design and development of the high-resolution spectrograph HERMES and the unique volume phase holographic gratings,”
Proc. SPIE, 8167 8167A
(2011). http://dx.doi.org/10.1117/12.897273 PSISDG 0277-786X Google Scholar
J. R. Zheng, L. Gers and J. Heijmans,
“Metrology measurements for large aperture VPH gratings,”
Proc. SPIE, 8838 88380G
(2013). http://dx.doi.org/10.1117/12.2024493 PSISDG 0277-786X Google Scholar
L. Waller et al.,
“AAO2: a general purpose CCD controller for the AAT,”
Proc. SPIE, 5499 452
–463
(2004). http://dx.doi.org/10.1117/12.550293 Google Scholar
S. Case, L. Gers and J. Brezki,
“Design and development of the fiber cable and fore optics of the HERMES spectrograph for the Anglo-Australian Telescope (AAT),”
Proc. SPIE, 8125 812504
(2011). http://dx.doi.org/10.1117/12.896389 PSISDG 0277-786X Google Scholar
R. Sharp, S. Brough and R. D. Cannon,
“Long-term stability of fibre-optic transmission for multi-object spectroscopy,”
MNRAS, 428 447S
(2013). http://dx.doi.org/10.1093/mnras/sts044 Google Scholar
T. J. Farrell, K. Shortridge and J. A. Bailey,
“DRAMA–an environment for instrumentation software,”
Bull. AAS, 25
(2), 444
(1993). Google Scholar
K. Shortridge et al.,
“The data flow system for the AAO2 controllers,”
Proc. SPIE, 5496 463
–468
(2004). http://dx.doi.org/10.1117/12.550362 PSISDG 0277-786X Google Scholar
K. Shortridge and M. Vuong,
“Faking it for pleasure and profit: the use of hardware simulation at AAO,”
Proc. SPIE, 7740 774008
(2010). http://dx.doi.org/10.1117/12.856216 PSISDG 0277-786X Google Scholar
B. P. Flannery et al., Numerical Recipes In C: The Art Of Scientific Computing Section 10.9, Cambridge University Press, New York
(1988–1992). Google Scholar
M. Goodwin et al.,
“The AAO fiber instrument data simulator,”
Proc. SPIE, 8446 84462D
(2012). http://dx.doi.org/10.1117/12.924990 PSISDG 0277-786X Google Scholar
M. Goodwin et al.,
“Data simulator for the HERMES instrument,”
Proc. SPIE, 7735 77357U
(2010). http://dx.doi.org/10.1117/12.856773 PSISDG 0277-786X Google Scholar
J. Dahl et al.,
“Algorithms and software for total variation image reconstruction via first-order methods,”
Numer. Algorithms, 53 67
–92
(2010). http://dx.doi.org/10.1007/s11075-009-9310-3 Google Scholar
R. Sharp and H. Parkinson,
“Sky subtraction at the Poisson limit with fiber-optic multi-object spectroscopy,”
MNRAS, 408
(4), 2495
–2510
(2010). http://dx.doi.org/10.1111/j.1365-2966.2010.17298.x Google Scholar
R. Sharp and M. N. Birchall,
“Optimal extraction of fiber optic spectroscopy,”
Publ. Astron. Soc. Aust., 27
(1), 91
–103
(2010). http://dx.doi.org/10.1071/AS08001 Google Scholar
Z. Arzoumanian, J. Holmberg and B. Norman,
“An astronomical pattern-matching algorithm for computer-aided identification of whale sharks,”
J. Appl. Ecol., 42 999
–1011
(2005). http://dx.doi.org/10.1111/j.1365-2664.2005.01117.x Google Scholar
G. M. De Silva et al.,
“The GALAH survey: scientific motivation,”
MNRAS, 449
(3), 2604
–2617
(2015). http://dx.doi.org/10.1093/mnras/stv327 Google Scholar
Ken Freeman and Joss Bland-Hawthorn,
“The new galaxy: Signatures of its formation,”
ARAA, 40 487
(2002). http://dx.doi.org/10.1146/annurev.astro.40.060401.093840 Google Scholar
Steve B. Howell et al.,
“The K2 Mission: Characterization and Early Results,”
PASP, 126
(938), 398408
(2014). http://dx.doi.org/10.1086/676406 Google Scholar
BiographyAndrew Sheinis is the head of instrumentation at the Australian Astronomical Observatory and adjunct faculty at University of Sydney. He is the project lead for HERMES and the Gemini High-Resolution Spectrograph. His research interests include galaxy evolution and black hole—galaxy connections. He holds seven patents and is a fellow of the Astronomical Society of Australia. Prior to joining AAO, he was faculty at the University of Wisconsin in Madison. Joss Bland-Hawthorn is an Australian laureate fellow and the director of the Institute for Astronomy at the University of Sydney. His main research interests are in galactic archaeology and near-field cosmology; galaxy formation and evolution. He is the cofounder of the Institute of Photonics and Optical Science, and founder of the Sydney Astrophotonic Instrumentation Labs. He has developed many instrument concepts with a special interest in photonic applications to astronomy and space science. Gayandhi De Silva is the HERMES Project scientist at the Australian Astronomical Observatory and holds a joint position at the University of Sydney. Prior to that she was an ESO Fellow at Paranal Observatory. Her main research interests include galactic archaeology, open star clusters as tracers of star formation within the Galaxy. She specializes in high-resolution spectroscopy and serves as an executive for the GALAH survey. Kenneth Freeman is a Duffield professor of astronomy at the Research School of Astronomy and Astrophysics in the Australian National University, Canberra. He was one of the first to point out (1970) that spiral galaxies contain a large fraction of dark matter. His interests are on the formation and dynamics of galaxies, and currently, he is working on dark matter and galactic archaeology. He won the 2014 Gruber Prize for cosmology for his research. Sarah Martell is the coproject scientist for the GALAH survey, a major survey project using the HERMES spectrograph. Her scientific focus in on the chemical abundances of old stars in the Milky Way and the process of galactic chemical evolution. She is a lecturer at the University of New South Wales. |
|||||||||||||||||||||||||||||||||||||||||||||||||||||||||||||||||||||