|
|
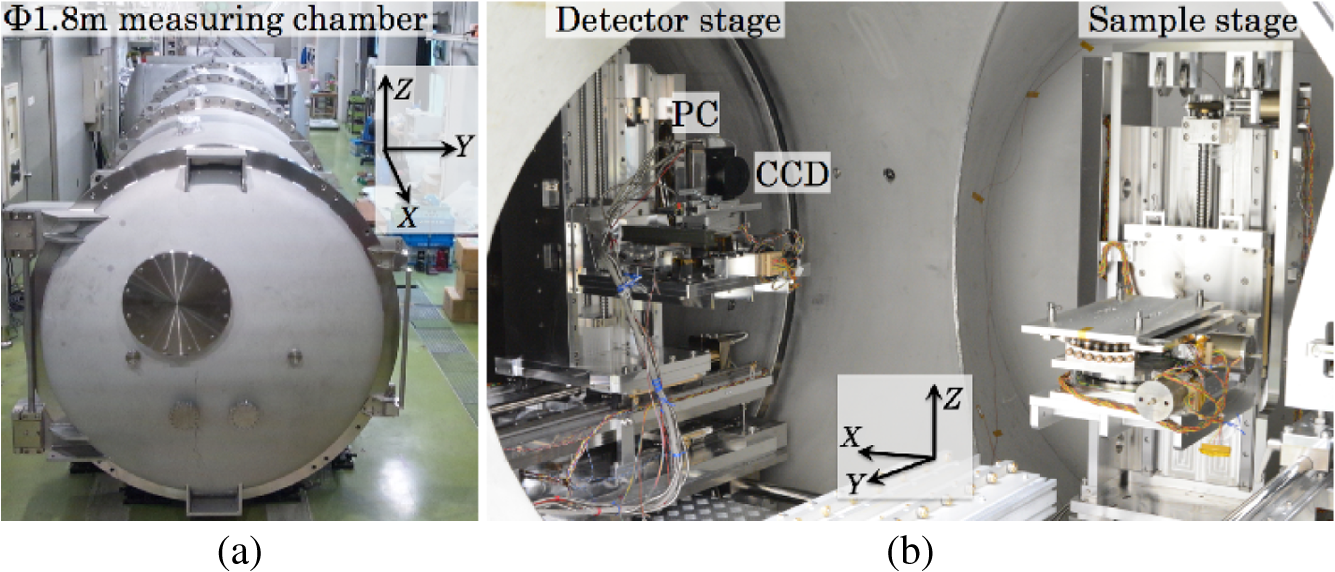
1.IntroductionBecause of their great distance, x-rays emitted by celestial objects are nearly parallel by the time they arrive at earth. While it is preferred to calibrate the telescope using a parallel beam of x-rays with a diameter equal to that of the telescope, this is extremely difficult to achieve in practice. An alternative method is to use a large-size diverging beam from a small x-ray source located at a distance much further than the focal length of the sample telescope. In this case, the telescope is fully illuminated by the beam while the focal length at the finite source becomes a little longer due to the lens equation. This method successfully works for telescopes whose angular resolution is extremely good such as the Chandra high-resolution mirror assembly.1 X-ray telescopes of a tightly nested type were mounted on the Suzaku satellite. For the tightly nested type of X-ray telescopes, the half-power diameter (HPD) of the encircled energy function and the mirror effective area cannot be correctly measured with a large diverging beam. For parallel light, the full area of the primary and secondary reflectors is effective. However, due to the tight nesting of the reflectors of the tightly nested type, diverging beams cannot illuminate the lower portion of the primary reflectors because of shadowing by the inner reflectors. Moreover, the reflected x-rays from the upper portion of the primary reflectors do not arrive at the secondary reflectors because of the finite incident angle of the diverging beam. Consequently, the edges of the reflectors contribute less to the focusing of the focal plane image when a diverging beam is utilized for the measurement. For example, the diverging angle at the outermost reflector reaches about 5.3 arc min for the outermost reflector of ATRO-E2 even for utilizing Panter facility, whose distance between the source and sample is 130 m.2 A beam with a much smaller divergence is required for the calibration of these telescopes. The 30-m x-ray pencil beam line at the Institute of Space and Astronautical Science (ISAS) is a unique beam line that provides a pencil-beam raster-scan for a diameter of up to 40 cm.3 The beam line is characterized by a pencil beam with a small diverging angle of for the beam size. It also has two synchronized moving stages on which an x-ray telescope and two detectors are mounted. This feature allows us to illuminate the entire aperture of the mounted telescope with a pencil beam of small divergence, which provides an accurate measure of both the effective area and the global image quality (HPD). In fact, it was utilized for ground-based calibrations of the x-ray telescopes onboard the ASTRO-D (ASCA4), ASTRO-E,5 InFOCS,6 and ASTRO-E2 (Suzaku)7 satellites as well as for performance evaluations of many of the trial models. The response functions of the x-ray telescopes onboard satellites were developed by reference to the data taken in this beam line. The focal length and the aperture of different x-ray telescopes are diverse, each being optimized for a given scientific goal. For example, the focal length of the soft x-ray telescope (SXT) of ASTRO-H is 5600 mm,8 which was longer than the maximum limit of the distance between the mounted telescope and the detectors (4750 mm) in the ISAS x-ray beam line. Conversely, the lower limit of the distance (3500 mm) was longer than, e.g., the 700 mm of the focal length of the Four-Stage X-ray Telescope (FXT) of the Diffuse Intergalactic Oxygen Surveyor satellite.9 Moreover, the aperture of the SXT is 450 mm, which was also larger than the range in which the stages could move (400 mm). Due to this wide variation in aperture and focal length (and, thus, calibration requirements), we upgraded the ISAS x-ray beam line after 2011, replacing it with a vacuum chamber and stage system. At present, a telescope with an aperture 45 cm in diameter and with a focal length up to 9 m can be fully scanned with a pencil beam. At the same time, a new charge-coupled device (CCD) consisting of of size was introduced. Moreover, a housekeeping system monitoring the temperature and the contamination in the vacuum chamber was also newly installed for safety operations while measuring samples. 2.Institute of Space and Astronautical Science Upgraded Beam Line Systems2.1.Vacuum ChamberA schematic view of the beam line is shown in Fig. 1. A Cartesian coordinate system of the ISAS beam line is set up with the x-ray beam direction defining the axis and the direction opposite to the direction of gravity defining the axis. The axis is then formed from the exterior product of . Fig. 1Upgrated ISAS beam line. The distance between an x-ray source and the movable slit is 27 m. The total volume is separated into seven sections by six gate valves indicated by cross marks. A “measuring chamber” has been introduced whose diameter and length along the x-ray beam are 1.8 and 11.3 m, respectively. In the measuring chamber, the distance between a sample and the detectors can be changed, because the detector stage is movable along the -axis. The details of the components described in gray on the figure are presented elsewhere.10  The ISAS beam line consists of seven vacuum chambers that are separated by a gate valve (Fig. 1). The pressures are monitored by the vacuum gauges section by section. The primary instruments are put into two of the six chambers—a measuring chamber and an atmospheric chamber. The other chambers contain somewhat minor instruments.10 In this upgrade, we have introduced one large measuring chamber [Fig. 2(a)] at the downstream in which the measuring sample and detectors are installed together. The measuring chamber is cylindrical with a diameter and length of 1.8 and 11.3 m, respectively. The largeness of the measuring chamber allows us to install a detector-X stage, which changes the distance between a sample and detectors (see Sec. 2.2). In the measuring chamber, two T-type thermocouples and a contamination monitor (thermoelectric quartz crystal microbalance) are equipped, whose measuring points can be chosen arbitrarily around the upstream side of the measuring chamber. The measuring chamber is purged with dry air when the measuring sample is replaced. This procedure requires 2 to 3 h. On the other hand, bringing the chamber down to a vacuum requires 3 to 4 h to reach a level . If dry pumps (scroll pumps) are used as a roughing pump, an extra time of 1 to 2 h is needed for this process. A pressure as low as can be realized, which takes about 1 week. The other main chamber is the atmospheric chamber, which contains metal filters and a double-crystal monochromator (DCM) (Sec. 2.3). This chamber has been used since before the upgrade. The volume containing the atmospheric chamber except for the measuring chamber is usually not purged. 2.2.Stage SystemsThe telescope and detectors are mounted on individual stages referred to as the sample stage (S stage) and the detector stage (D stage), respectively [Fig. 2(b)]. Ranges of movement, moving speeds, and resolutions of the stages are listed in Table 1. The sample stage moves the mounted telescope along the and axes, and rotates around the , , and axes with automated controls. An x-ray CCD and a proportional counter (PC) (see Sec. 2.4) are mounted on the D stage and are automatically moved along the and axes. Moreover, the D stage can be moved by hand along the -axis in a large range of up to 8.3 m, which enables us to choose an arbitrary distance between the sample and the detectors in the range of 0.7 to 9 m. Also, a rotational displacement around the -axis between the S and D stages due to the movement of the D stage along the -axis can be corrected with rotating the set of the detector stage around the -axis (). Note that a telescope of up to 500-mm diameter aperture can be fully scanned with the x-ray beam, because the mounted sample and the detectors can be moved in an area of normal to the x-ray beam. Table 1Stage parameters.
The straightness accuracy of the move for the stages has been measured with an autocollimator. The straightness is a very important parameter when making raster measurements that are performed with the two stages moving simultaneously. Here, yawing, pitching, and rolling are defined in Fig. 3 with reference to the directions of the x-ray beam and each moving axis. Figure 4 shows the straightness as angle changes of the stages with the position of each moving axis. Note that as for the rolling of each stage (i.e., rotation around some axis with moving along that axis: , , , and ), we obtained only its upper limit and it is not plotted in Fig. 4. The yawings of the S and D stages when moving along the ( and ) and axes ( and ) are less than 10 arc sec. Meanwhile, the pitchings of the -axes of the two stages ( and ) are larger, and the angular changes along each axis are and for and , respectively. The pitching of the other axes ( and ) are intermediate and no larger than 30 arc sec. The upper limit of the rolling of the detector -axis () is somewhat larger and is about 60 arc sec. The limits of the rollings of other axes are 15, 20, and 25 arc sec for the sample -axis, -axis, and the detector -axis (, , and ), respectively. Fig. 3Definition of yawing, pitching, and rolling. Yawing is rotation in a space containing the beam line (see Fig. 1) direction and each moving direction. Pitching is rotation in a space containing the exterior product of the beam line direction and the moving direction. Rolling is rotation around the moving direction.  Fig. 4Straightness of the (a) sample stage and (b) the detector stage measured with an autocollimator. Black and red correspond to the -axis and -axis of the two stages, respectively. The triangle and square show rotation around the -axis (pitching) and -axis (yawing) for the -axis moving ( or and ), respectively, and around the -axis (pitching) and Y-axis (yawing) for the -axis moving ( or and ).  2.2.1.Beam wobbling of the raster scanThe error of the straightness of the stage system results in “wobbling” of the image and a vignetting curve during a raster scan.5 If the sample stage rotates by around an axis normal to the x-ray beam, the incident x-rays from the x-ray generator are offset by . A vignetting curve will then be smoothed by the rotation wobbling. The different movement due to the wobbling rotation of the sample and detector stages results in a discrepancy of the position between the two stages. The discrepancy offsets the image position. The high-accuracy straightness of the sample stage guarantees that the uncertainty of the direction of incident x-rays is 20 arc sec. Measurements of the vignetting curve of the telescope can then be made with an accuracy of 20 arc sec, regardless of its focal length. For example, for ASTRO-H SXTs, whose vignetting can be reproduced by a Lorentzian function with the full width at half maximum of 16 arc min at 4.5 keV, a difference of the incident angle of 20 arc sec around the - and -axes because of the straightness causes a difference of effective area of 0.2% around the peak of the vignetting and around an off-angle of 5 arc min, where the variation of the effective area is steeper. Note that the above values regarding the effective area are maximum for cases in the SXT’s aperture and are not realities when the SXT’s total quality is considered. As for the detector stage, a rotation of 60 arc sec around the - and -axes is even less important, because those only result in an image shift on the detector in the order of even at the maximum case where the detector stage is placed in the maximum of . The alignment also provides merit for telescopes with a very short focal length (). For a telescope with such a short focal length, the detector can also be mounted on the sample stage together with the telescope. The image wobbling at the focus is also expected to be within the alignment of 20 arc sec during a raster scan. For a telescope with a focal length longer than 1 m, the detector must be mounted on the detector stage. The main error of the comovement of the sample and detector stages is dominated by the wobbling motion of the pitching angle along the detector’s Y stage. The pitching of the Y-axis of the S stage of shifts irradiated point on a measuring telescope in direction with at maximum, i.e., when the stage is located at a maximum of . This shift is not important in most cases, because a correct irradiated point on the telescope is not important for measuring the total qualities when the sample stage needs to be moved within a wide range such as above a few hundred mm. By contrast, the pitching of the detector stage of along its Y stage shifts a focusing point on detector by at maximum, which is consistent with a size of 11 pixels of our CCD. For example, for the ASTRO-H SXT whose focal length is 5600 mm, a focusing point shift of corresponds to the angular wobbling of , which is almost negligible against its HPD of , although it is comparable to its point spread function (PSF) core width. 2.3.X-Ray BeamIn the ISAS beam line, the x-ray generator named Rigaku RU-200 has been used. The generated x-ray beam propagates through a metal filter or the DCM and is shaped into a rectangular pencil beam by a movable slit 27 m distant from the x-ray generator. The characteristics of the x-ray beam are shown in Table 2. Table 2X-ray beam characteristics.
When x-rays are generated, a metal target is irradiated by thermal electrons with 5 to 60 keV energies. The metal targets that can be chosen are C, Al, Ti, C, Mo, W, and Pt. The metal filter for monochromating can be chosen among Al , Ti , or Ni . The DCM can be used for 4 (Ti-) to 18 keV (Mo-). We note that a number of metal filters or some other filters and the DCM cannot be combined. In Table 2, the beam size is the size at the sample, which must be larger than the slit size, because the beam must have finite divergence. Therefore, the beam size is 0.2 mm at the sample even if the slit is narrowed to almost 0 mm, because of the divergence of the passed beam of 8 arc sec caused by a finite x-ray source size. For a typical case of beam size of , the beam divergence is about 20 arc sec. 2.4.DetectorsThe PC and CCD are mounted on the detector stage, which can be automatically replaced by each other with a dedicated stage in the vacuum. The characteristics of the two detectors are given in Table 3. Table 3Detector characteristics.
The PC has a window of thick aluminized mylar and includes P10 gas, which consists of 90% of Ar and 10% of by default. The included gas can be replaced by an arbitrary gas, because the PC is of the gas flow type. Figure 5 shows sample x-ray spectra acquired by the PC. Figure 5(a) is metal-filtered Al and Ti spectra in which the emission lines of each element (Al-: 1.49 keV and Ti-: 4.51 keV) are prominent. Note that the second peak appearing in the metal-filtered Al spectrum around 7 to 8 keV is due to bremsstrahlung, which can even be resolved by energy resolution of the PC. Figure 5(b) is Cu- (8.05 keV), Pt- (9.44 keV), Pt- (11.07 keV), and Pt- (12.94 keV) emission lines extracted by the DCM, where the escape peaks of Ar- (2.96 keV) are also prominent. Fig. 5X-ray spectra acquired with the proportional counter. (a) Spectra of Al (black) and Ti (red) targets with Al and Ti filters, respectively. The Al- (1.49 keV) and Ti- (4.51 keV) lines (mixture of K- and ) make the highest peak in each spectra. (b) Spectra of Cu and Pt targets with the double crystal monochromator, which is aligned for Cu- (8.05 keV, black) for the Cu target and Pt- (9.44 keV, red), (11.07 keV, green), and (12.94 keV, blue) for the Pt target. Note that the amplifier gain adopted in (a) is higher than that in (b) by two times.  The other detector is the CCD, which is used primarily for the measurement of image qualities. The CCD measures of size . The CCD is cooled down to with Peltier devices, which are also cooled down with cooling water maintained at a constant temperature of 20°C for measurements. Figure 6 is a sample of a CCD image and a rectangular x-ray beam, whose range is from 250 to 5000 ADU and whose scale is logarithmic. Figure 7 is a projection profile. This image includes a horizontal over-clock region ( on the right side) and a vertical over-clock region ( on the top), which allows us to estimate both the bias level and the charge-transfer noise for each frame. Fig. 6Image of x-ray beam acquired with the CCD. Brightness is logarithmic scale from 250 to 5000 ADU. The direct image is centered at the CCD center (630,576) and extra regions on the right () and top () sides are a horizontal over-clock region and vertical over-clock region, respectively. Figure 7 shows the projection profiles of the direct beam, where the direct beam is quite uniform except for the edges.  3.Example of MeasurementsHere, we show an example result of the kinds of measurement that are possible with the upgraded ISAS beam line. With a light source at a finite distant from the telescope, the light focusses on a place more distant than the nominal focal length, following the lens equation. If a detector is placed at its nominal focal length, the image obtained is defocused with a width proportional to the used beam size. This influence is not significant for the estimation of the characteristics of rough image quality such as HPD or effective area, in general, if a thin beam such as is used, because these values are insensitive to the detailed image structure. By contrast, measurement of the PSF core and detailed structure of the images are significantly influenced by the defocusing. In the upgraded ISAS beam line, the distance between the sample telescope and the detectors can be chosen in the range of 0.7 to 9.0 m for each measurement. For example, the nominal focal length of the SXT onboard the ASTRO-H satellite is 5600 mm with a corrected focal length when taking into account the infinite distance from the x-ray source of 7085 mm for the ISAS beam line. Both of the focal lengths are within the allowed range. Moreover, with the corrected focal length, the beam size does not influence the sharpness of the focussed image because the rectangular beam is focused, although a size corresponding to the source size is left. This allows us to use a somewhat wider beam. However, we note that a wider beam has a larger divergent, which leads to the vignetting effect in the beam-irradiated area. Figure 8 shows images of SXT-I11,12 (coupled with the soft x-ray imager of the ASTRO-H), and panels (a) and (b) which were acquired with the nominal focal length and the corrected focal length. The beam was used for the measurement of the nominal focal length, considering defocusing proportional to the beam size and measuring time. The beam makes a defocusing size of . By contrast, the beam was used for the corrected focal length measurement, taking into account the vignetting effect. The incident angle to the aperture of a sample is 70 arc sec at most in this case. The field of view of the two panels of Fig. 8 is common—, although that acquired at the nominal focal length is wider by reverse proportion to the ratio of the nominal focal length to the corrected focal length. The comparison between the two panels clearly shows that the image with the corrected focal length has more detailed structure and a sharper PSF core than those with the nominal focal length. In the corrected focal length image, the radially extended dark structures result from the alignment bars (each of which align 203 reflectors) included in the SXT. Note that even in measurement at the corrected focal length, image extension because of the finite source size must occur. 4.SummaryWe upgraded the ISAS 30-m x-ray pencil beam line, where ground-based calibrations of the x-ray telescopes onboard the ASTRO-D, the ASTRO-E, the ASTRO-E2 satellites, and so on were carried out. This was done to accommodate the needs due to both the increase and decrease in the sizes of x-ray telescopes in use or planned to be used. In this upgrade, a measuring chamber was introduced in which the measuring sample and detectors are installed together. In this chamber, the distance between the sample and the detectors can be arbitrarily set within the range 0.7 to 9 m. A measuring telescope and detectors (CCD and PC) are mounted on the sample stage and the detector stage, respectively. A telescope of up to 500-mm diameter aperture can be fully scanned with the x-ray beam without rotation of the telescope around the x-axis, because the movable range of the stages is more than . Rotations of the two stages around the x-axes with movement along the y-axes of the sample and detector stages (pitching) are relatively large and change by 40 and 60 arc sec, respectively. The pitching of the other axes and the yawing of all the axes are less than 30 arc sec. As for rolling, only the upper limits were obtained because of the difficulty in measuring them. The upper limit of the detector axis is somewhat larger and is about 60 arc sec, while those of the other axes are less than 30 arc sec. The x-ray from the generator is shaped into a rectangular pencil beam of to by the slit 27 m distant from the x-ray generator. A metal target for the generator can be chosen among C, Al, Ti, C, Mo, W, and Pt. The DCM can be used for 4 (Ti-) to 18 keV (Mo-), and the metal filters of Al, Ti, and Ni can be used for any targets. The beam divergence is 20 arc sec for of slit width. The PC in the ISAS beam line has a window and includes P10 gas as the default, and the CCD consists of of size . We can choose a variety of distances between the telescope and detectors for any measurement purpose. With the focal length corrected for the finite distant of the source, more detailed structure in the image can be clearly detected. Using a distance shorter than the nominal focal length gives a wider field of view.13 We performed measurements of the ASTRO-H SXT-I images using the corrected focal length and acquired more fine-structured images and a sharper PSF core than those with the nominal focal length. AcknowledgmentsThe authors are grateful to Mr. Kou Ichiharaand Mr. Kazuki Tomikawa for early phase upgrading of the beam line. Prof. Yuzuru Tawara at Nagoya University and Dr. Satoshi Sugita at Ehime University gave us an opportunity to make the thin optical blocking filter that is used in the CCD camera. Prof. Hiroshi Tsunemi at Osaka University provided us with the proportional counter. The companies, Hamamatsu Photonics K.K., Kohzu Precision Co., Ltd. and TOYAMA Co., Ltd. provided the CCD camera, the stage system, and the chambers, respectively. Mr. Chris Baluta gave us editorial support. We thank them for their efforts on production and support. ReferencesM. C. Weisskopf et al.,
“Chandra x-ray observatory (CXO): overview,”
Proc. SPIE, 4012 2
–16
(2000). http://dx.doi.org/10.1117/12.391545 PSISDG 0277-786X Google Scholar
Y. Maeda et al.,
“Soft x-ray calibration for the NeXT x-ray telescope,”
Proc. SPIE, 7011 70112O
(2008). http://dx.doi.org/10.1117/12.788652 PSISDG 0277-786X Google Scholar
H. Kunieda et al.,
“Thirty-meter x-ray pencil beam line at the Institute of the Space and Astronautical Science,”
Jpn. J. Appl. Phys., 32 4805
(1993). http://dx.doi.org/10.1143/JJAP.32.4805 Google Scholar
Y. Tsusaka et al.,
“Characterization of the advanced satellite for cosmology and astrophysics x-ray telescope: preflight calibration and ray tracing,”
Appl. Opt., 34 4848
–4856
(1995). http://dx.doi.org/10.1364/AO.34.004848 APOPAI 0003-6935 Google Scholar
R. Shibata et al.,
“X-ray telescope onboard Astro-E. II. Ground-based x-ray characterization,”
Appl. Opt., 40 3762
–3683
(2001). http://dx.doi.org/10.1364/AO.40.003762 APOPAI 0003-6935 Google Scholar
T. Okajima et al.,
“Characterization of the supermirror hard-x-ray telescope for the InFOCmuS balloon experiment,”
Appl. Opt., 41 5417
–5426
(2002). http://dx.doi.org/10.1364/AO.41.005417 APOPAI 0003-6935 Google Scholar
P. J. Serlemitsos et al.,
“The x-ray telescope onboard Suzaku,”
Publ. Astron. Soc. Jpn., 59 S9
–21
(2007). http://dx.doi.org/10.1093/pasj/59.sp1.S9 PASJAC 0004-6264 Google Scholar
Y. Soong et al.,
“ASTRO-H soft x-ray telescope (SXT),”
Proc. SPIE, 9144 914428
(2014). http://dx.doi.org/10.1117/12.2056804 PSISDG 0277-786X Google Scholar
Y. Tawara et al.,
“Development of the four-stage x-ray telescope (FXT) for the DIOS mission,”
Proc. SPIE, 9144 914461
(2014). http://dx.doi.org/10.1117/12.2055082 PSISDG 0277-786X Google Scholar
Y. Maeda et al.,
“An x-ray calibration facility with a dynamical pencil beam for the post-Astro-E2 telescopes,”
Proc. SPIE, 4851 734
–741
(2003). http://dx.doi.org/10.1117/12.461338 PSISDG 0277-786X Google Scholar
R. Iizuka et al.,
“Ground-based x-ray calibration of the Astro-H soft x-ray telescopes,”
Proc. SPIE, 9144 914458
(2014). http://dx.doi.org/10.1117/12.2054626 PSISDG 0277-786X Google Scholar
T. Sato et al.,
“Revealing a detailed performance of the soft x-ray telescopes of the ASTRO-H mission,”
Proc. SPIE, 9144 914459
(2014). http://dx.doi.org/10.1117/12.2055622 PSISDG 0277-786X Google Scholar
K. Ichihara et al.,
“A ground calibration of the engineering model of the SXT onboard ASTRO-H using the ISAS 30 m pencil beam facility,”
Proc. SPIE, 8443 844357
(2012). http://dx.doi.org/10.1117/12.925860 PSISDG 0277-786X Google Scholar
BiographyTakayuki Hayashi was a JAXA aerospace project research associate at Institute of Space and Astronautical Science, Japan Aerospace Exploration Agency (JAXA). Currently, he is with Nagoya University as a superlative postdoctoral fellow of research fellowships for young scientists. He is a member of the ASTRO-H collaborations. |
||||||||||||||||||||||||||||||||||||||||||||||||||||||||||||||||||||||||||||||||||||||||||||||||||||||||